这次使用基于黑盒测试上面。用来收集监控blackbox的数据
https://github.com/prometheus/blackbox_exporter
https://github.com/prometheus/blackbox_exporter/blob/master/blackbox.yml
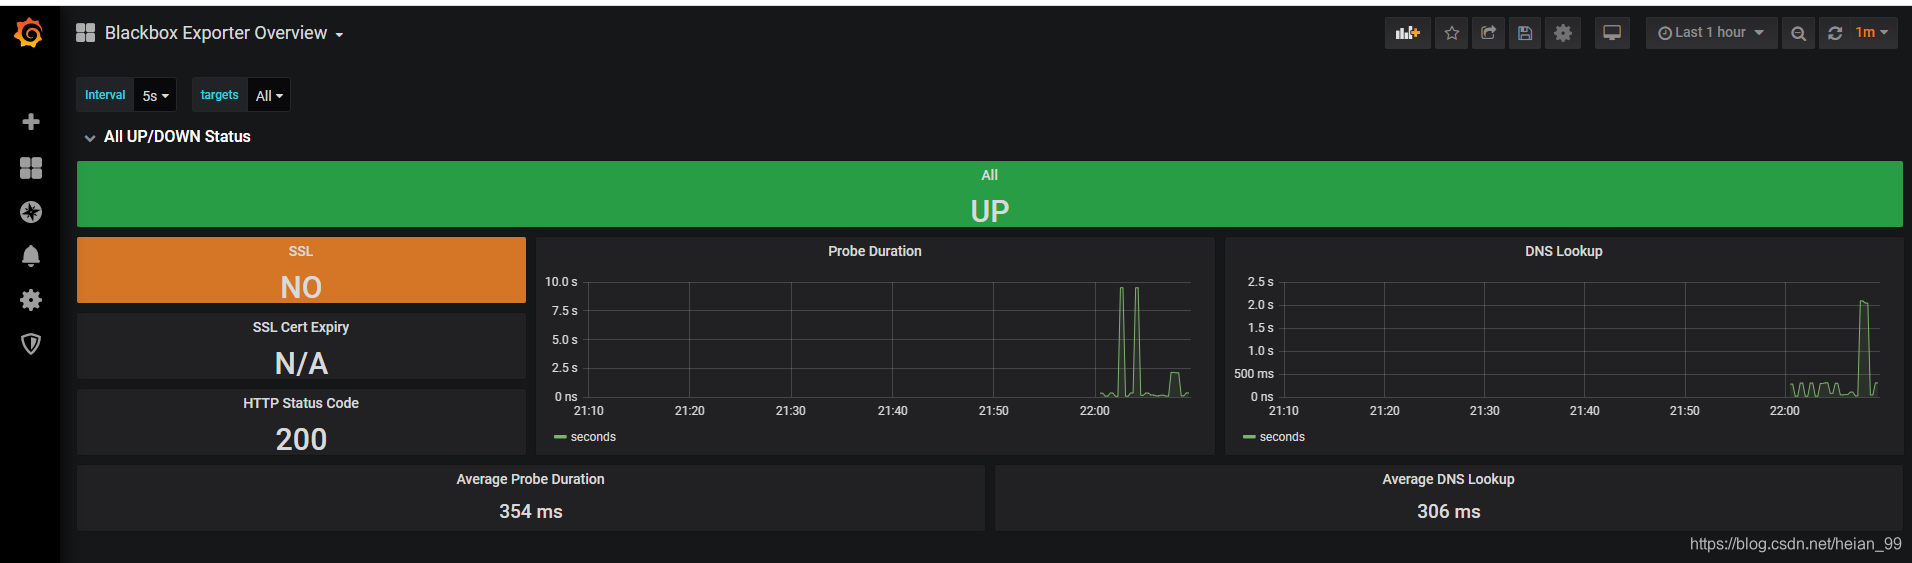
https://grafana.com/grafana/dashboards/5345
1、创建secrets
官网地址:https://github.com/prometheus-operator/prometheus-operator/blob/master/Documentation/additional-scrape-config.md
 1
 2
 3
 4
 5
 6
 7
 8
 9
10
11
12
13
14
15
16
|
cat prometheus-additional.yaml

- job_name: 'blackbox'
  metrics_path: /probe
  params:
    module: [http_2xx]  # Look for a HTTP 200 response.
  static_configs:
    - targets:
      - http://www.baidu.com	  # 这里我们监控百度网站测试
  relabel_configs:
    - source_labels: [__address__]
      target_label: __param_target
    - source_labels: [__param_target]
      target_label: instance
    - target_label: __address__
      replacement: blackbox-exporter:9115  # The blackbox exporter's real hostname:port.
|
1
2
3
|
kubectl create secret generic additional-scrape-configs --from-file=prometheus-additional.yaml --dry-run -oyaml > additional-scrape-configs.yaml

kubectl apply -f additional-scrape-configs.yaml -n monitoring
|

2、修改Prometheus的CRD
 1
 2
 3
 4
 5
 6
 7
 8
 9
10
11
12
13
14
15
16
17
18
19
20
21
22
23
24
25
26
27
28
29
30
31
32
33
34
35
36
37
38
39
40
|
[root@k8s-master01 manifests]# vim prometheus-prometheus.yaml

apiVersion: monitoring.coreos.com/v1
kind: Prometheus
metadata:
  labels:
    prometheus: k8s
spec:
  alerting:
    alertmanagers:
    - name: alertmanager-main
      namespace: monitoring
      port: web
  image: quay.io/prometheus/prometheus:v2.15.2
  nodeSelector:
    kubernetes.io/os: linux
  podMonitorNamespaceSelector: {}
  podMonitorSelector: {}
  replicas: 1
  resources:
    requests:
      memory: 700Mi
  ruleSelector:
    matchLabels:
      prometheus: k8s
      role: alert-rules
  securityContext:
    fsGroup: 2000
    runAsNonRoot: true
    runAsUser: 1000
  serviceAccountName: prometheus-k8s
  serviceMonitorNamespaceSelector: {}
  serviceMonitorSelector: {}
  version: v2.15.2
  additionalScrapeConfigs:
    name: additional-scrape-configs
    key: prometheus-additional.yaml

[root@k8s-master01 manifests]# kubectl replace -f prometheus-prometheus.yaml
prometheus.monitoring.coreos.com/k8s replaced
|
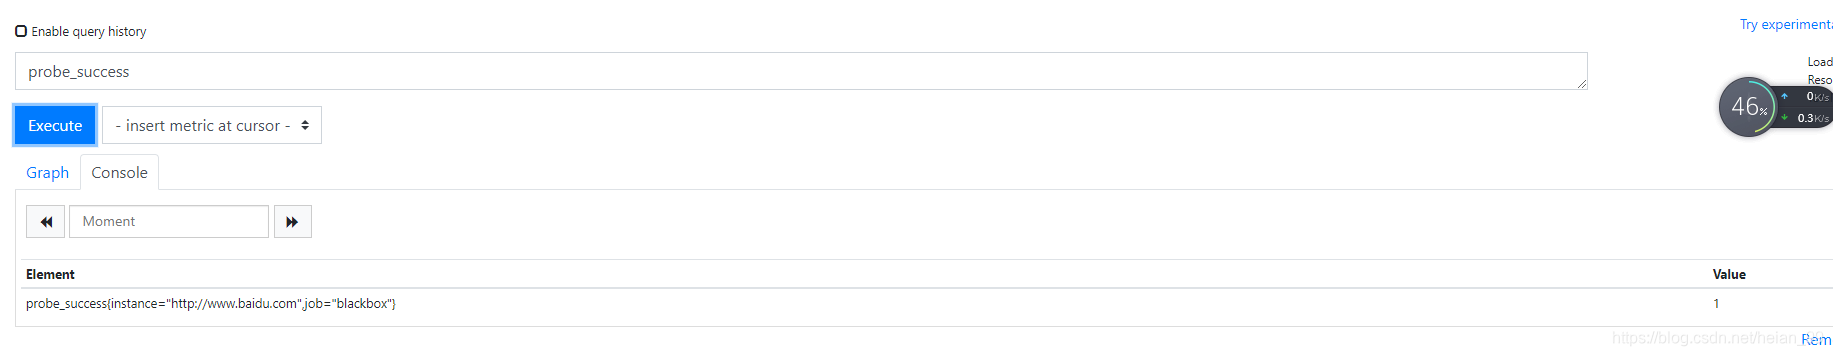
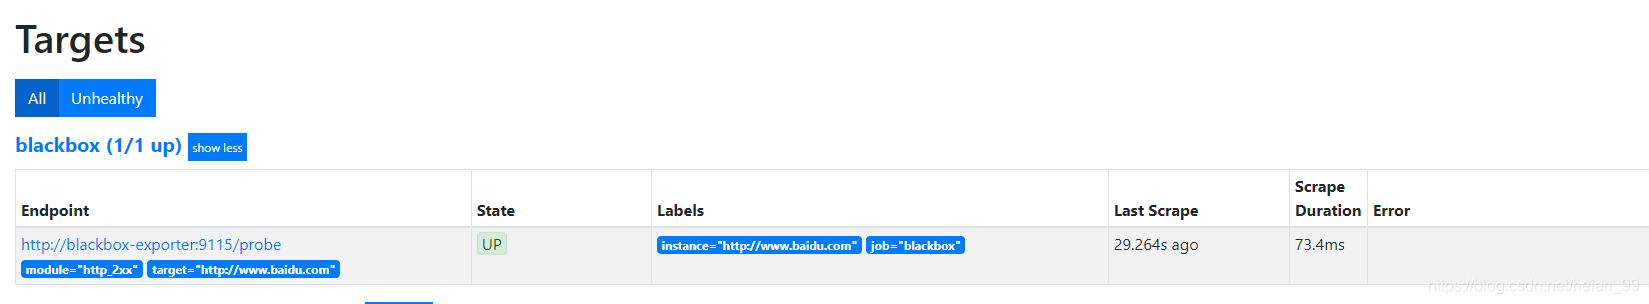
3、Prometheus测试验证